
 The design of sheet pile walls–and specifically analyzing them from the standpoint of sliding, overturning, and excessive bending stresses–is one of the more challenging aspects of geotechnical design. That’s because sheet piling are totally dependent upon balancing the lateral earth pressures on both sides of the wall while at the same time insuring their structural integrity.
Simple solutions for the problem are given in texts such as Verruijt and can be analyzed using charts such as one sees in DM 7.02. But real world problems are seldom this simple. The methodology used to analyze sheet pile walls using “classical” techniques is described in detail in Sheet Pile Design by Pile Buck, and software for that purpose–very useful to simplify the complex calculations from multi-layer soil profiles–is available in packages such as SPW 911. The expense of this software is easily justified for the practitioner who needs to design these walls in a timely and accurate fashion.
But how does one learn the basics of sheet piling software? And how can educators teach their students the basics of its use? The purpose of this article is to introduce the SPW 2006 software, from providing a download link to giving the basics of its use to showing some examples for both cantilever and anchored walls.
The Basics
First the download: it’s here
We also have a video tour of this software; click here to view it.
SPW 2006 was developed by Arnold Verruijt and some description of the software is given in the download. It has several important features that need to be mentioned up front:
- It doesn’t require installation; it’s a standalone executable that can be run, say, from a flash drive. That makes it simpler to run on systems other than your own (like a university’s.) It’s a Windows 32-bit executable; it runs fine in just about any Windows environment from 2000 onward (and maybe before) and will also run nicely in Linux or Mac under Wine.
- Unlike some of Verruijt’s software, it has a data file, which is an ASCII file that can be edited if you know what you’re doing. (If you don’t, don’t.) When you start the program, it’s very important to load a previously developed file (such as Demo.spw) before you start, for reasons given below. You’ll need to be diligent in saving it often, because the program isn’t consistent in telling you if you’ve altered the file before the program closes.
- The program is capable of printed output; however, I strongly urge you to have on your computer the capability of putting the printed output into an Adobe Acrobat file. Doing this will make it easier for you to save the output for use later. You can also do screen shots of some of the output, as will be evident shortly.
- The program input and output is strictly in SI units.
When you run the software and open the demo file, you are greeted with something like this:
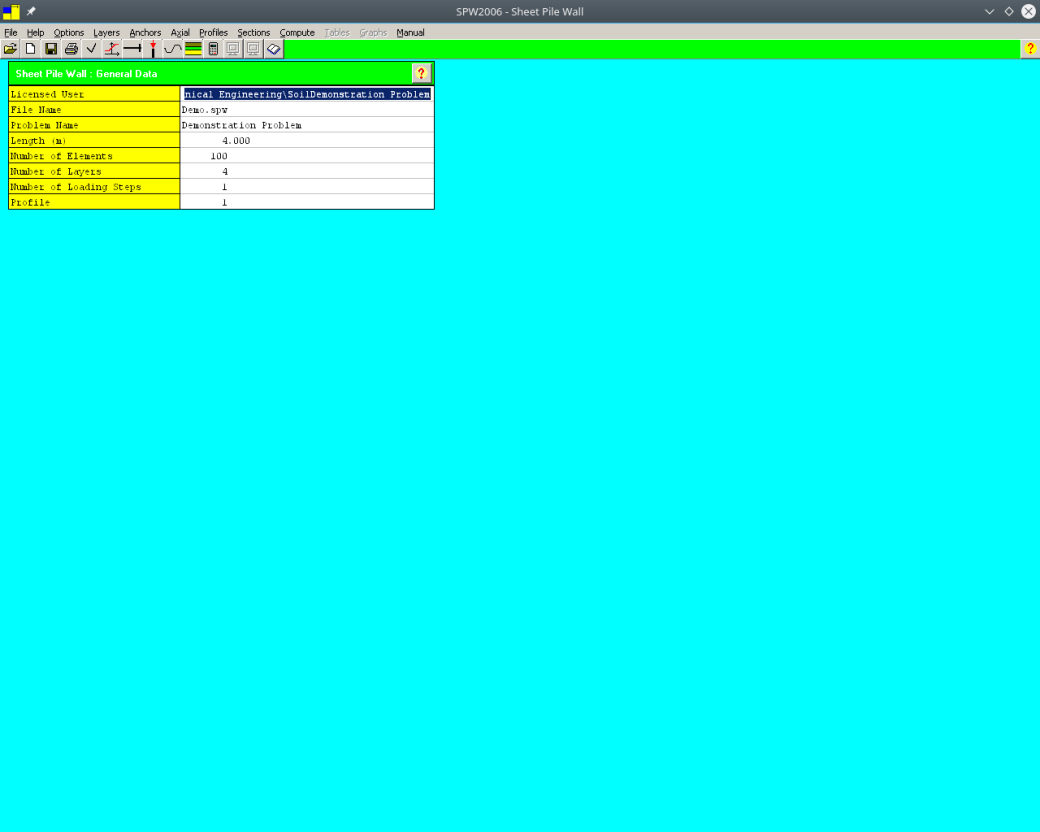
You’ll notice the toolbar on the upper right; the first three are obviously (from left to right) open file, new file, and save file. Next to that is the print command. The “check mark” is for the output options:
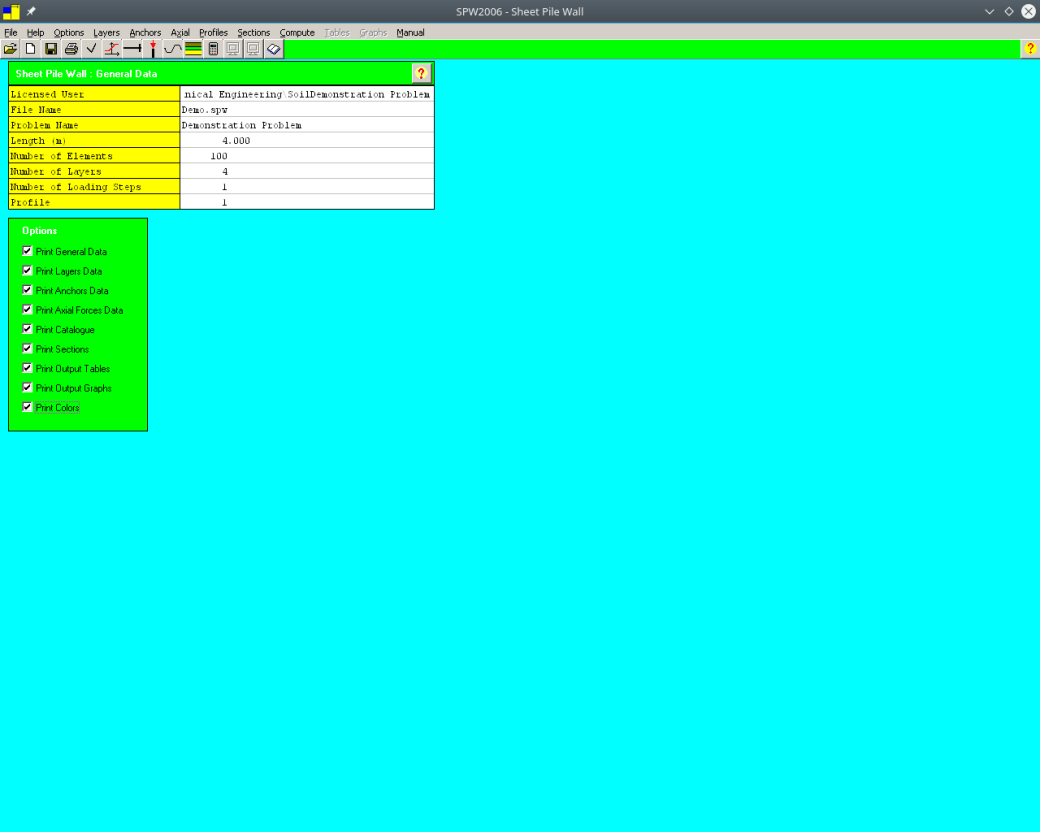
I strongly suggest that all of these be checked. After that we have the soil layer properties, which come up like this:
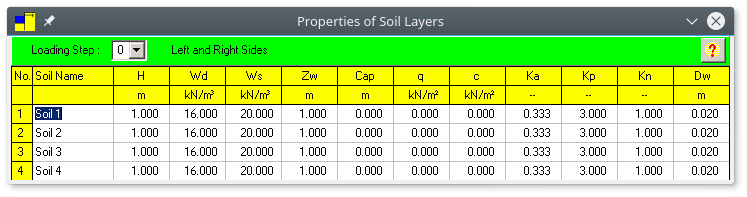
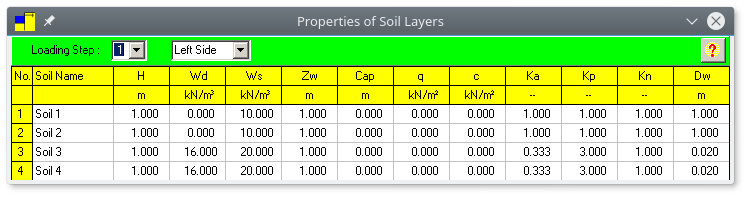
You will note the “Loading Step” Option. This is a departure from some earlier sheet pile programs in that the first loading step shows the soil layering on both sides to be the same. Subsequent loading steps show the soil layering after “excavation” from the “original state.” Thus for this, Loading Step 1 show this for the left side:
And for the right side:
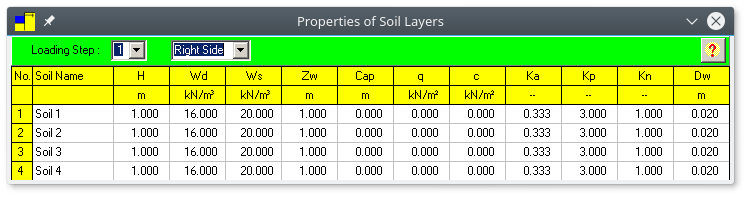
Note that the right side looks pretty much like the original. The left side’s first two layers have zero Wd (dry unit weight) which is the way you tell the program the layers are “excavated” for a given side. The “?” mark is the button for online help, which explains the variables, for each of the input tables.
 One variable that needs some explanation is the Dw, or “stroke” of the soil. SPW 2006 incorporates soil-structure interaction (SSI,) which means that the force of the soil varies as the wall moves away (or towards it) rather than the “all or nothing” approach common with classical methods. We’ll discuss this in more detail with the cantilever wall example.
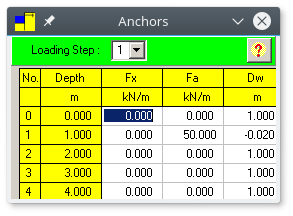
The next button is for the anchors, we’ll explain those when we get to the anchored wall example. Unlike some classical software packages, SPW 2006 designs for a non-rigid anchor. This, it’s necessary to note the maximum allowable anchor force and the displacement necessary to achieve that force. We’ll explain this in more detail with the anchored example.
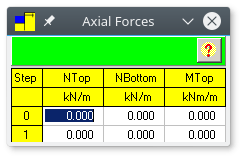 After this is the axial force exerted on top of the wall. Using sheet pile walls for bearing is common in Europe but hasn’t quite caught on in the US. Provisions for forces at both bottom and top of the sheet pile and a moment at the top of the pile are available.
 The last input dialogue box is the sheet pile catalogue. It contains a selection of steel sheet piling (although the program can certainly accommodate other materials.) The input of sheet pile section properties is probably the strangest aspect of the program for the following reasons:
- The database is limited to twenty (20) sections.
- The database is at the end of every data file. That’s why you need to start with a data file already developed; if you don’t, you won’t get the database.
- Verruijt’s original database had a collection of U-sheeting from Larssen and Hoesch. In our download in the demo, cantilever and anchored examples we give the database you see, which includes some Z-shapes.
- To pick one of these, you don’t pick one directly from the table, but the last entry in the General Data is the Profile number; the number you pick is the profile from the table.
- The database doesn’t feature the moment of inertia directly but an
quantity which is the product of the modulus of elasticity and the moment of inertia. This becomes significant in estimating the maximum moment and stresses.
- The “h” variable is confusing the way Verruijt defines it: “height of cross-section, in m.” For U-sheeting and the European practice of using two U-sections as one bending beam, that amounts to making the “h” the same as
in
. American designers have always been reluctant to allow this. On the other hand, Z-sections have never had this dispute. For this database, the “h” is the distance from the outer face of the sheeting to the neutral axis, or the “
The two examples will show how this data is used.
The program gives a simple profile that, for the “Loading Step 1” looks like this:
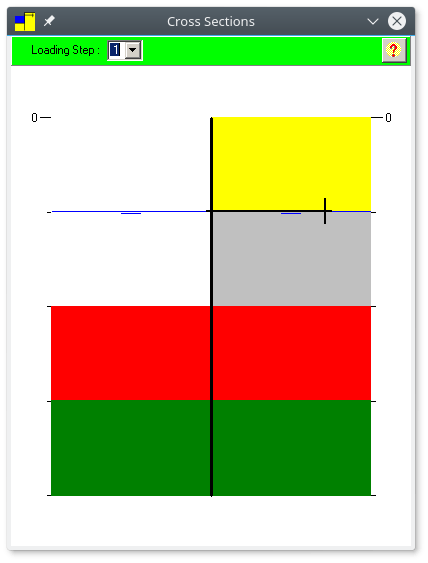
It is important to inspect this before running the program, using the “calculator” button. It’s easy to make a mistake, especially if you have more than one loading step (i.e., are modeling a progressive excavation, which is a common problem in sheet piling design.)
Unlike more sophisticated programs, it’s necessary to manually increment the pile penetration beyond the dredge line to determine the necessary length of the pile. You can do this in meter increments, 500 mm increments, or whatever step you would like, but you need to start with a very short penetration beyond the dredge line and increase it until you don’t get a floating point error in the calculations. This is done by changing the depth of the last layer in the soil profile input and re-running the calculations.
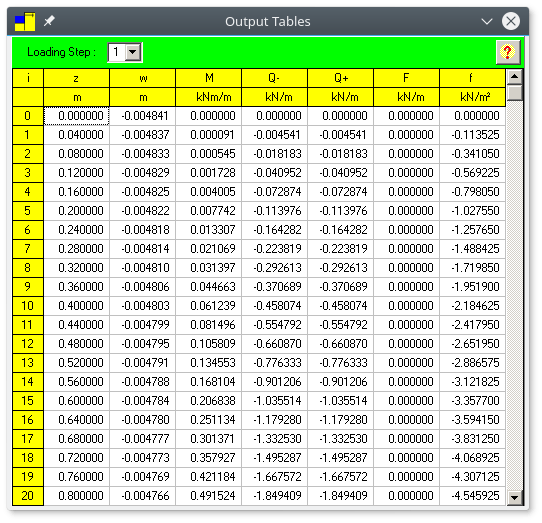
Once you’ve done this and arrived at a pile penetration, you can output the beam results for the sheet piling. This comes out in two ways: first, tabular:
And graphical:
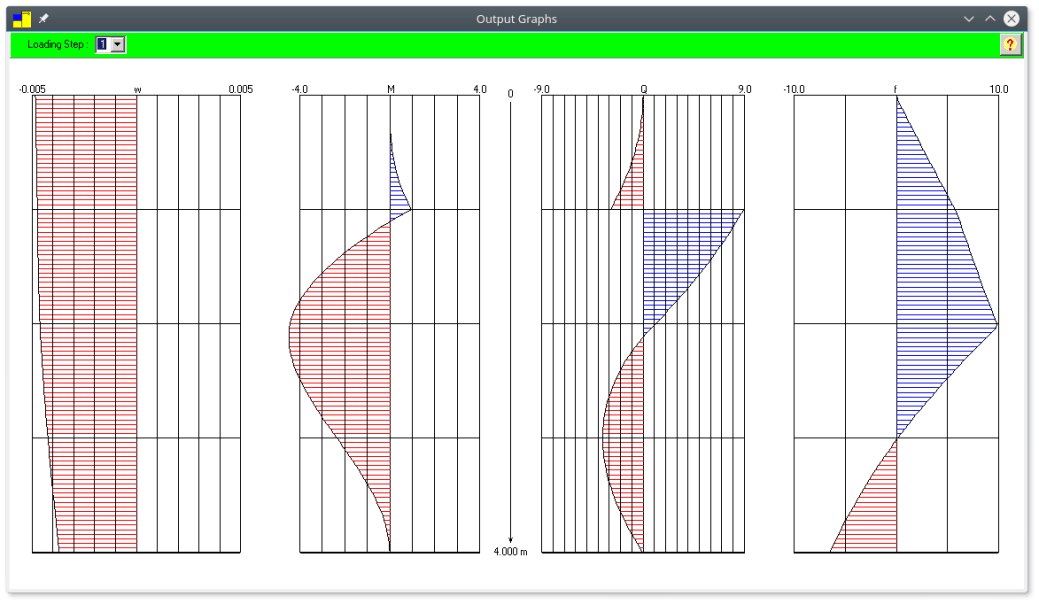
We will discuss how to analyze this data with the cantilever wall example. The printed output has much more detail than this.


11 thoughts on “Analyzing Sheet Pile Walls with SPW 2006: Part I, Introduction”