

Note: This study was commissioned by Vulcan and conducted in early December 1972 by United Acoustical Consultants of Glastonbury, CT, and dated 23rd June 1973. The report was submitted by the President of UAC, Mr. Stannard M. Potter. It has been released publicly by Vulcan at various times since its completion. This is the text for “Volume II” to the entire study. The graphs and other external references given in the report are not available. The fine print for this document applies.
A. DESCRIPTION OF TESTS
During the week of December 4th through December 9th, 1972, tests were conducted on a standard Vulcan Hammer, Size 1, at the Pile Hammer Test Stand in Chattanooga. Tennessee.
1. Test Site
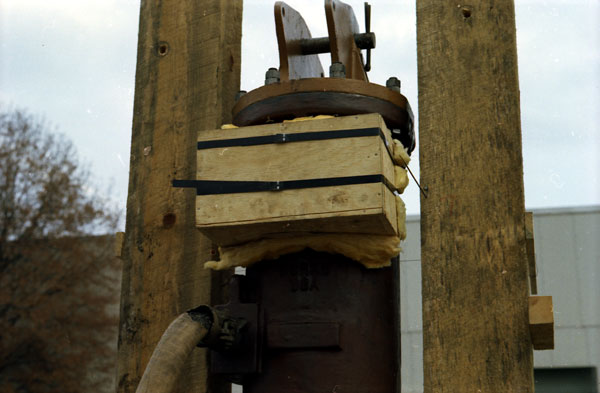
The normal structural steel test rig was removed and a special wooden support was provided to support the hammer in the test pit. The wooden beam structure prevented the secondary noise source from the steel structure from intervening with the hammer noise.
Unfortunately, the test stand site is within 75′ of the main manufacturing area of the Vulcan Plant. This provides a serious reflection of the noise from the hammer. There are other reflecting surfaces nearby. though they are smaller and at greater distances (250′). To the east of the test stand, the ground surface is hard pavement for all of the microphone locations. Although the site had acoustic shortcomings, it was felt that the proximity of the Vulcan Plant and its personnel was an obvious advantage over a possible “free field” at some distance from the plant. UAC’s Instrument Van was located in a supply shed next to the boiler room for the test stand at a distance of about 60′.
For the noise tests, the boiler and steam supply for the hammer were replaced by a truck-mounted air compressor unit. The truck was located in the front parking lot, as far away as the hoses would reach. A special muffler was designed to augment the exhaust noise reduction of the air compressor’s muffler. During the first two tests, this muffler proved inadequate and was replaced by a second unit, starting with Test 3 of the Muffled Auxiliary Exhaust.
The weather throughout the testing period was frequently cold and rainy. Wind protection was provided for the microphones and a plastic shield was built of thin vinyl in tent form over the hammer test rig to facilitate working during the rain during Test 11.
2. Instrumentation
Four microphone outputs were recorded on magnetic tape simultaneously. Three were data positions and one was for general announcements.
| Microphone | Location |
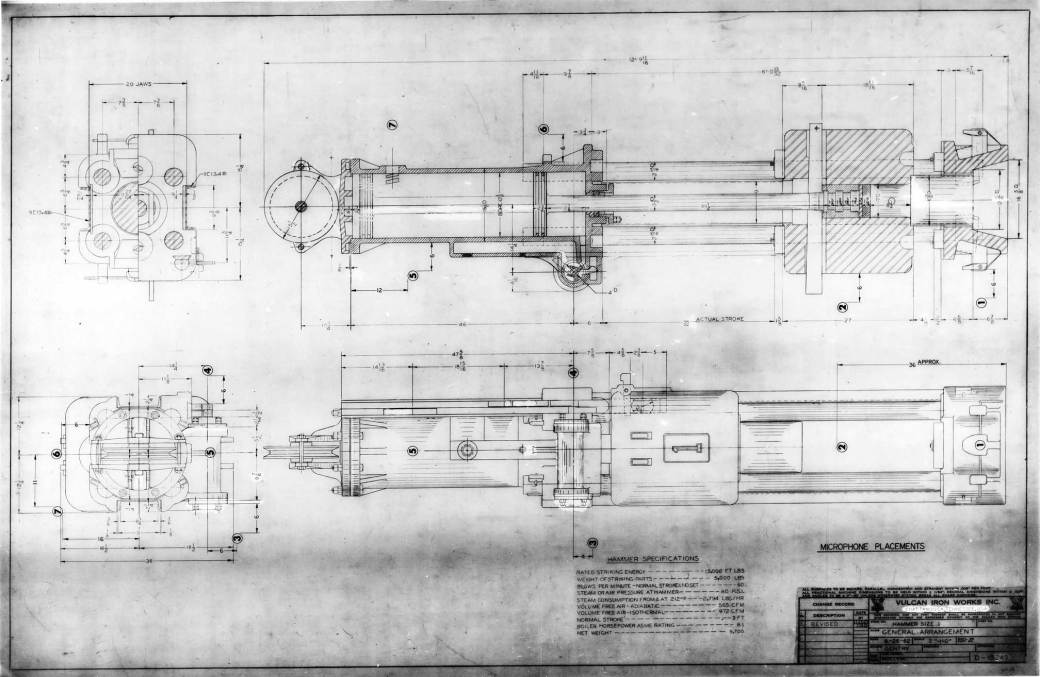
| A | Close to The Hammer – generally 6″ away from the radiating surface. (See Vulcan Drawing D-10249) 7 different microphone placements. |
| B | 25′ from the centreline of the Hammer 3 positions: Northeast, East, Southeast |
| C | 50′ from the centerline of the Hammer 3 positions: Northeast, East, Southeast |
Direct readings of Peak Impact Noise were made on an oscilloscope for later verification of laboratory playback.
For most of the tests. a direct field chart was made of the A-weighted output for use in direct assessment of the signal character during each of the tests.
A detailed list of the instrumentation is at the end of this section.
3. Hammer Configurations
There were eleven basic changes made to the hammer and its cushion, as listed below:
| Test No. | Hammer Configuration |
| 1 | Bare Hammer – Steel Cushion |
| 2 | Muffled Exhaust |
| 3 | Mufflex Auxiliary Exhaust and Air Compressor |
| 4 | Nylon Slide Bar |
| 5 | Ascon Cushion |
| 6 | Micarta Cushion |
| 7 | Wood Cushion |
| 8 | Wrapped Base + Double Auxiliary Exhaust |
| 9 | Wrapped Cylinder |
| 10 | Damped Ram – 1″ Plate and EAR on Ram |
| 11 | Ram Cover – Armaplate
|
Test No. 1
The Bare Hammer – Steel Cushion was a standard Vulcan Hammer, Size 1.
Test No. 2
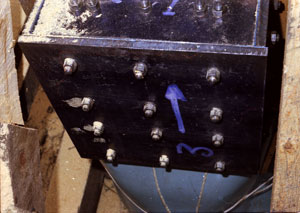
During the second test. the exhaust noise us muffled by coupling a flexible hose (heavy duty rubber) to the hammer exhaust port and piping the noise about 40′ away behind an embankment. The hose terminated in a wooden box lined with fibreglass. Unfortunately the seal between the rubber hose and the exhaust discharge duct leaked and it was not until Test No. 10 – Damped Ram – that the leak was properly sealed.

Test No. 3
A single chamber plywood box stuffed with fiberglass was affixed to the Auxiliary Exhaust Port with an opening transverse to the normal auxiliary exhaust airflow.
Tests No. 4 thru 7 are self-explanatory

Test No. 5
The base of the hammer was covered so that as much of the exterior radiating surface as possible was enclosed with 2″ of polyurethane foam. This was covered with a second layer of foam attached to a lead vinyl sheet manufactured by Ferro Composites. Norwalk, Conn. At the same time the Auxiliary Exhaust Muffler was rebuilt to contain a second chamber. Again, the plywood box was lined with flberglass and protected with netting and the gas flow exhausted to atmosphere through a side port transverse to the normal auxiliary exhaust air flow.
Test No. 9
 The cylinder was treated in the same manner as the base.
Test No. 10
A sheet of rubber-like damping material (nominally 1/4″ thick) with the trade name EAR, manufactured by the National Research Company, a Division of Cabot Industries Cambridge. Mass., was clamped between the outer surfaces of the ram and a 1″ steel plate. The plate was attached to the ram with nuts and lock washers on previously installed ram studs. Unfortunately, due to the non-uniformity of the ram castings. only a small percentage of the radiating area was actually damped even after machining some surfaces of the ram.
 Test No. 11
A cover comprising a steel plate bonded to rubber (about 1/4″ thick) with the trade name ARMAPLATE, manufactured by Goodyear, was fashioned to cover the entire exterior part of the ram. Tests were run with a) a Steel Strike Plate and b) a Micarta Strike Plate.
B. METHODS OF ANALYSIS
1. instrumentation for Impact Analysis
Three different types of instruments were compared to evaluate the Peak Level of impact. Since this part of the noise cycle is a sharp transient the response characteristics of instruments are bound to give different values.
a. General Radio Impact Analyser
This Is an instrument which is designed to retain the Peak Sound Level on a meter so that the meter can he read easily. Though it has several different settings such as Time Average, Peak and Quasi Peak, we only tested the Peak.
b. Dumont Oscilloscope with a compressed time base
The vertical deflection of the scope trace was read from a persistent screen with a recticle which had been calibrated previously. With the exception of the inaccuracy in the visual readout the scope has the fastest and most accurate response of all the instruments.
c. Sanborn Graphic Level Recorder
The electronic circuitry controlling the writing pen ballistics was redesigned to give a nominal 0.005 seconds rise time. In any such display device with transient stimuli, the pen tends to over ride the actual peak level due to inertia. For the analysis used in this report, an actual writing speed of 6000 millimetres/sec. without overshoot was obtained. By moving the paper fast enough under the deflecting pen, a very clear display of the noise amplitude variation (Sound Pressure level in dB vs. time) is obtained. A comparison of all three methods indicated similar spectra. Though the Peak Impact levels from the Sanborn charts were lower (between 3 and 9 dB) than the Impact Analyser and Scope, it appeared to be consistent. The Sanborn Graphic Level Recorder has the very important advantage that it shows all the detail in the complete noise cycle while the Impact Analyser and the Scope show only Peak Impact level. This allowed us to make a detailed analysis of the various parts of the cycle affecting the total noise emanations. It was decided that the knowledge of the detailed parts of the cycle was more important than the absolute value of the Peak Impact level. Correction factors were added to all Band Pressure Levels affected by the high writing speed circuitry to provide a flat response. Accordingly. the method of analysis used for tape playbacks on tile Sanborn Graphic level Recorder
2. Sanborn Charts
a. Noise Signatures
To determine the uniformity of the noise spectra and the reliability of using a single cycle for analysis, copies of the charts showing the variation in Noise Signatures were made for linear, dB(A), 63 Hz and 2000 Hz. These data will be found in Volume III of this report. To obtain the dB Level on the ordinate (vertical direction) for any of the charts, reference should be made to the digital information presented for the Peak Impact Level in dB re 20 u N/m&Mac178; given in Tables IA thru F in Volume II. The Noise Signature charts are identified by a GR73 No. in the upper right-hand corner of each page. Turning to the tabulated digital data, the Noise Signature identifying numbers will be found under the Column “Graph 73-” in the right-hand column of each table. The noise levels in dB are listed under the appropriate column for each of the Octave Bands, Lin and dB(A).
To obtain the Sound Pressure Level of any portion of any cycle, relate the digital data to the Impact Peak. For example, GR73-024 is the analogue output for three successive cycles of the Bare hammer – Test 1, for the Microphone A located at the Base of the Hammer with a steel cushion. The synchronous readout on four channels, top to bottom, is for –
- LIN short for Linear Weighting Network: includes all frequencies with a flat frequency response for engineering purposes and some contract specifications.
- dB(A) short for “A” Weighting Network: it weighs the frequency response of the spectra closely with human auditory response and is frequently used in legislation.
- 63Hz short for 63 Hertz Octave Band Pressure level: the lower practical band for noise evaluation both for engineering and subjective purposes.
- 2000 Hz same as above except the Octave Band Center frequency is 2000 Hertz instead of 63 Hz.
Thus, in studying these charts. one can see
- how repetitive the noise signatures are, and
- roughly whether the peaks comprise low frequencies (costly to fix) or high frequencies (easier to reduce).
The smallest divisions are 1 dB for the ordinate and 0.02 seconds for the abscissa. The heavy lines are 5 dB and 0.1 seconds, respectively. A “blip” at one second intervals is given at the bottom or 5th trace on each chart.
On certain charts the 4th channel is the “Ticker” signal from the trip switch installed to insure identification of the ram position. It replaces the 2000Hz trace. Another variation of chart (GR73-165 thru 179), the dbA(A) channel has moved from channel 2 to 4.
For discussion or the noise signatures, we have arbitrarily divided the cycle of GR73-024 as follows:
| Seconds | Identification |
| 0-0.14 | Impact – the vertical rise of the trace indicating the instant of impact is used as the time reference. |
| 0.14-0.48 | Rise – the period of lifting the ram. |
| 0.48-0.64 | Exhaust – that part of the cycle normally dominated by the exhaust. |
| 0-64-1.06 | Fall – the remainder of the cycle before the next impact. |
Obviously, the time periods will vary slightly with the variation of pressure and ram weight (especially with the EAR, Test 10). but the four basic parts of the cycle will be useful for reference.
To determine the sound pressure level of any part of the analogue trace, say the exhaust peak of 024 LIN, refer to the digital tables in Volume II for the appropriate reference Line GR73-024, find the Peak Impact Sound Pressure Level = 137 dB. On GR73-024 in Volume III, we have written in these values above the peaks. Again. referring to the LIN trace, note the dB level reduces after impact to 113 dB at the beginning of the Rise period and reaches as low as 103 dB before Exhaust. The Peak Exhaust of this cycle is about 123.5 or 124 dB. The next Exhaust Peak is 123 dB.
b.Noise Cycle Spectra
The Noise Cycle Spectra are a composite of the Linear, db(A) and eight Octave Bands from 63 Hz – 8000 Hz Noise Signatures for the same hammer noise cycle. These are published for each test and source microphone location as well as 50′ East. The number above the impact part of the cycle is the Sound Pressure level for the Octave Band or Weighting Network at Peak Impact. It is from these spectra that the digital data were obtained. For any part of the noise cycle, the Sound Pressure level in dB re 20 u N/m&Mac178; can be determined referencing the Sanborn Chart grid system and file units described above. Since the subjective reaction to the hammer noise Is a function of frequency, it is important to know how the noise varies with frequency. This spectral information also is important as to the control measures that are required to reduce the noise.
3. Digital Data
When there is a large body of steady state analysis to be done, it is most efficiently done with a Real Time Analyser. In the case of the many events during the pile hammer noise cycle, the Real Time Analyser falls short. The analyser needs to be started at the precise instant the event of interest occurs. The synchronization problem associated with the event time and the analyser starting time is, at present, unsolved. If the hammer cycle was constant to within a fraction of the impact duration, one could then program a computer to start the analyser at the instant desired. Of course, the hammer cycles are not that constant, particularly during a test program involving changes to the ram weight. For this reason, the digital data, determined in this study, have all been obtained manually from the analogue readouts on the Sanborn charts.
4. Statistical Distribution Analysis
Though major events such as ram impact, exhaust and impacts from the valve tripping mechanism are discernible from the noise signature, the affect of different hammer configurations is not readily determined for the entire noise signature. To assess the changes in the total signature, Statistical Distribution Analyses were made for certain microphone locations and hammer configurations.
These data are determined from an inspection of the noise signature at each 50th/sec interval. If the cycles are dissimilar, more than one cycle is analysed. The results are then tabulated for each level and the cumulative percentages are determined. The data are plotted on probability graph paper to show the deviation from Gaussian distribution. From each individual random source. the curve should be a straight line when plotted on the probability paper. Thus, sharp discontinuities in the curvature of the Statistical distribution indicate the dominance of another type of random source. For the most part, the curves show few straight line portions other than ambient. We interpret this to mean that several of the sources are intermingled in the noise signature at any one time.
The data are very useful because, at any individual percentage of the time, the effectiveness of each hammer configuration can be assessed by merely subtracting the differences between the Statistical Distribution Levels.
One will notice on each Statistical Distribution plot that there are two different abscissas. At the bottom of the graph, the percentages are Indicated as the “% Time Noise is Lower Than the Indicated Level”. At the top of the graph, the reverse percentage in plotted as the “‘% Time Noise is Higher Than the Indicated Level”. It is the latter scale which is finding increasing acceptance by legislative bodies and standards organizations.
These Sound Pressure Levels in dB are simply referred to as L followed by the percentage. For example, “L40” means that 40% of the time the noise is above the level quoted for “L40”.
C. RESULTS OF TESTS
The results of file tests are contained in Volumes II and III as follows:
|
VOLUME II |
|
| Section | |
| E | UAC Drawing No. DWG. NO. 730V2 Section E is actually a graphical summary of file tests which are on a drawing labelled “Peak Impact”. The drawing is folded and tucked in the pocket in the front of Volume II’s binder. This summary shows the variation of the Linear Sound Pressure Level as a function of time for each test and each microphone location. These are representative cycles taken from the noise signatures. This drawing affords an overview of the entire test. |
| F | Tables IA thru F |
| G | Noise Cycle Spectra – Graphs No. 188 thru 277 |
| H | Statistical Distribution Analyses – Tables II, III, IV Graphs No. 398 thru 402e, 435 thru 475 |
|
VOLUME III |
|
| Noise Signatures Graphs No- 024 thru 179B |
|
For access to any particular data. use the GR73 number cross referenced in the Data Index.
D. ANALYSIS OF DATA
a. Noise Signatures and Cycle Spectra
a. Test 1 – BARE
At each of the microphone positions. there are two dominant noise sources and their Peak Sound Levels are listed below:
| Mike | Impact | Exhaust |
| 1- Base | 138 | 124 |
| 2 – Ram | 136 | 126 |
| 3 – Exhaust | 134 | 144 |
| 4 – Trip | 136 | 125 |
| 5 – Top Cyl. | 132 | 124 |
| 6 – Bot. Cyl. | 133 | 119 |
| 7 – Aux. | 134 | 118 |
| 25′ | 112 | 106 |
| 50′ | 104 | 101 |
Except when the mike is at the Exhaust the Impact noise dominates.
As the mike is moved away from the base, the level is lower except at the Trip and the Auxiliary Exhaust. It may well be that the piston at impact transmits to the cylinder wall and certainly the columns do. The Auxiliary Exhaust ports open directly to the interior of the cylinder which acts like a reverberation chamber. These differences are minor but do show clues to the sources. Generally, the whole hammer radiates during Impact as one would expect with such rigid connections between the supporting structure. The levels range around 135 dB and project to 25′ at 112 dB and 104 dB at 50′. It is recognized that the area is reverberant around the Test Stand and, if anything, levels at 25′ and 50′ are probably high. From this data, we calculate an equivalent spherical radius equal to roughly 1.5′. Calculated radius is 2.9′. Obviously. the whole hammer is not radiating or it has directional characteristics.
Certainly the Exhaust appears to be directional as one might expect from examination of the above table. Moving from Position 3 to Position 2, a distance of only 4′, changed the Impact noise by only2 dB while the Exhaust noise changed 18 dB. Measuring perpendicular to the Exhaust axis at distances of 25′ and 50′, the levels drop by 38 and 43 dB, respectively, showing the source radius to be only 0.315′ in contrast to the estimated physical radius of 0.47′. Obviously. the Exhaust is not only small but directional. The Exhaust source, though small in size and directional, is a very potent 144 dB or 6 dB higher than the apparent peak Impact noise.
See Table A for the estimated Equivalent Radiating Area Spherical Radii of other hammer parts.
The Exhaust directionality is partially attested, as the far field mikes are moved to the Southeast Positions (more in line with the Exhaust). Though the increase is a modest 2 dB for 50′, it is a drop of 2 dB for the 25′ mike distance. The reason for this is not clear except for the less reverberant condition (no direct reflections – See Vulcan drawing P168). Note that the Trip Mike Position 4 is only 3′ away but the level is lower than the Ram at 4.5′. This shows how easy the shadowing of the valve chest can hide the dominantly short wave lengths of the Exhaust which peaks at 2000 Hertz as shown in the Noise Cycle Spectra GR73-190. All of these factors must be considered in designing the control measures.
|
VULCAN HAMMER NOISE |
|||
| Total Area = 104.8 Square Feet | |||
| Source | % of Total Mech. Area | Square Feet | Equivalent Spherical Radius Feet |
| A. Mechanical | |||
| 1. Ram | 32.2 | 33.7 | 1.63 |
| 2. Cylinder | 26.5 | 27.8 | 1.49 |
| 3. Base | 17.3 | 18.1 | 1.20 |
| 4. Columns | 14.3 | 15.0 | 1.10 |
| 5. Valve Chest | 3.4 | 3.6 | 0.54 |
| 6. Sheave | 3.3 | 3.5 | 0.53 |
| 7. Piston Rod | 3.0 | 3.1 | 0.50 |
| 100.0 | 104.8 | ||
| B. Aerodynamic | |||
| 1. Exhaust | 2.74 | 0.47 | |
| 2. Auxiliary Exhaust | 4.74 | 0.61 | |
b. Other tests
Other observations of interest are:
- The trip noise shows up before and after the Exhaust.
- The Bottom Rear Cylinder radiates a similar shaped bulge after impact as the Auxiliary Exhaust.
- An unexplained increasing level just prior to Impact as seen principally at the Exhaust which disappears in the Damped Ram, Test 10 – possibly piston rod seal leakage.
- Exhaust Port seal leakage clearly disappears in Test 10.
- The Nylon Slide Bar allows a possibly puzzling increase in its impact noise over the steel bar. Subjectively, the steel bar has a ringing that the Nylon Slide Bar lacks. The data, however, do not bear this out. Though the presumed Exhaust leak between the Trip Impacts disappears, it does so when the cylinder is wrapped in Test 9 instead of Test 10 when the leak was fixed. The inconsistency of this signature may well be due to the flexibility of the Nylon. particularly after the Cylinder wrapping.
- One of the most dramatic changes in the Impact noise occurs when the Peak level drops from 134 dB to 123 dB at the Top Cylinder after it was wrapped.
- Most of the change in the Peak Impact level was very gradual and actually negative at times. It shows the difficulties attendant to a noise reduction program of this type. When the overall reduction is dependent on a lot of small changes, much control must be exercised over the test technique and accuracy.
- It is quite obvious in studying the 25 and 50′ signature that much of the significant source noise sort of “washes out” as one gets further from the hammer. This is particularly true of high frequencies and one should be cautious in expecting this to happen with low frequencies. If the low frequencies are high enough in level, they will still control the measurement even though the hammer may seem a lot quieter.
- By similar observation and calculation. one comes to the conclusion that the principal sources are listed below in approximate order of importance.
- Ram
- Cylinder
- Exhaust
- Auxiliary Exhaust
- Trip
- Base
- Columns
- Valve Chest
- Sheave
- Piston Rod
2. Statistical Distribution Analysis
Though the Peak Impact Level dominates the undetailed information of the enforcer’s meter, it is not a significant measure of the quietness quotient. For example. the difference in Peak Impact Levels between Tests 1 and 10 is only 1 dB and 4 dB at 25′ and 50′, respectively. Obviously, some other measure is required to evaluate the substantial reduction in Loudness observed by the listener. Statistical Distribution Analysis helps fill this need since it measures the entire signature every 0.02 seconds.
a. Linear Probability Graphs
From the Probability Graphs. data has been summarized in Tables II, III and IV showing the differences between incremental changes in hammer configuration an well as the overall. These overall differences have been plotted as Probability Graph Noise Reductions, GR73-447 thru 453. showing the maximum reduction from Test 1 to 10 as 32 dB at L20 and the Auxiliary Exhaust Position. The maximum source noise reductions are tabulated below:
| Mike | Percentile | dB Reduction |
| 1 – Base | L50-20 | 16 |
| 2 – Ram | L50 | 18 |
| 3 – Exhaust | L30 | 25 |
| 4 – Trip | L40 | 21 |
| 5 – Top Cyl. | L30 | 27 |
| 6 – Bot. Cyl. | L40 | 27 |
| 7 – Aux. Ex. | L20 | 32 |
b. Histograms
Comparative Noise Reductions are shown at the L40, L30, L20 and L3 Percentiles for each change in hammer configuration at 50′ East. The pattern clearly speaks well for the Damped Ram, though we must caution that the Exhaust leak was also fixed during this test. Still it shows as the best at most of the Percentiles and we have noted before that only a small percentage of the damping plate was actually constraining the EAR to the Ram. Even so, a substantial reduction was obtained. This, coupled with the fact that the Ram has the largest Radiating Area, makes it the number one control measure to be applied in the hammer redesign.
In Graph GR73-454, the overall differences are given for each test change while Graph GR73-455 more clearly shows the contribution of each change by itself.
c. Octave Probability
From these graphs. the data in Table V has been derived which in turn has lead to the Statistical Spectra Summary graphs.
d. Statistical Spectra Summary Graph
Finally, the “proof of the pudding” is in the actual reductions achieved at likely observer distances. Graphs 472 thru 475 show the overall reduction in noise at a distance of 50′ for the L40, L30, L20 and L3 Percentiles. Levels of Noise Reduction for the annoying frequencies of 500 Hz and above ranged from 14 – 20 dB for all except the brief Percentile of L3 where the Noise Reduction ranged from 4 to 12 dB.
With the above evidence. it is proven that a concerted design and evaluation effort will pay substantial dividends in quieter pile hammers. Recommendations for appropriate control measures are given in Volume I of this report.
INSTRUMENTATION LIST
Field
- Microphones
B&K 4135 S/N 125108
B&K 413S S/N 125107
AKG C60 S/N 382
GR 1560-P40 - Power Supplies
B&K 280L S/N 144144, 144736
AKG N60EA S/N 148
GR 1560-4100
CR Octave Band Analyser 1558AP, S/N 203 - Attenuators
UAC S/N’s 60, 61, 62 - Recorders
Ampex 351 S/N 4042057
Preamp Channel A S/N 27688
Preamp Channel S S/N 28677
Ampex 351 S/N 0140176
Preamp Channel A S/N 34053
Preamp Channel B S/N 29042
Sanborn Strip Chart Recorder 954B-1OO
Log Preamps 350-1400
Channel A S/N 922, Channel B S/N 928, Channel C S/N 867, Channel D S/N 625 - Other Equipment
Hewlett Packard Scope 120B S/N 601-06957
B&K Octave Filter Set
KLH Speaker Model 6 S/N 35950
B&K Microphone cable set
Taylor weather Station
LABORATORY
- Ampex Playback Deck 351A S/N 4840140
- Marantz Power Amp S/N 5042
- B&K 1612 1/3 Octave Band filter
- B&K Octave Filters
- Sanborn Strip Chart Recorder 954B-100
Log Preamps 350-1400
Channel A S/N 922, Channel B S/N 928, Channel C S/N 867, Channel D S/N 625 - Dumont Scope 401B S/N 160
- GR Octave Band Analyser 1558AP S/N 203
GR Impact Noise Analyser 1556A S/N 767 - Dynaco Monitor Preamp
- CM labs Power Amp S/N 0266
- KLH Speakers Model 6 S/N 35950, 35839


2 thoughts on “Vulcan Hammer Noise Study”